Strategy Tester Report
AlpariUK-Demo (Build 225)
| Symbol | EURUSD (Euro vs US Dollar) | ||||
| Period | 1 Hour (H1) 2009.08.03 01:00 - 2009.10.01 00:00 (2009.08.01 - 2009.10.01) | ||||
| Model | Control points (a very crude method, the results must not be considered) | ||||
| Parameters | TakeProfit=50; Lots=0.1; InitialStop=30; TrailingStop=20; | ||||
| Bars in test | 1124 | Ticks modelled | 25909 | Modelling quality | n/a |
| Mismatched charts errors | 7 | ||||
| Initial deposit | 10000.00 | ||||
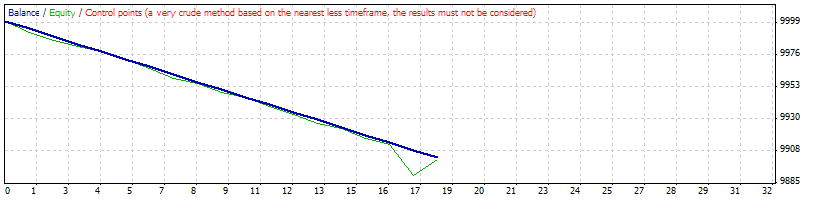
| Total net profit | -97.20 | Gross profit | 0.00 | Gross loss | -97.20 |
| Profit factor | 0.00 | Expected payoff | -5.40 | ||
| Absolute drawdown | 97.20 | Maximal drawdown | 106.70 (1.07%) | Relative drawdown | 1.07% (106.70) |
| Total trades | 18 | Short positions (won %) | 0 (0.00%) | Long positions (won %) | 18 (0.00%) |
| Profit trades (% of total) | 0 (0.00%) | Loss trades (% of total) | 18 (100.00%) | ||
| Largest | profit trade | 0.00 | loss trade | -5.40 | |
| Average | profit trade | 0.00 | loss trade | -5.40 | |
| Maximum | consecutive wins (profit in money) | 0 (0.00) | consecutive losses (loss in money) | 18 (-97.20) | |
| Maximal | consecutive profit (count of wins) | 0.00 (0) | consecutive loss (count of losses) | -97.20 (18) | |
| Average | consecutive wins | 0 | consecutive losses | 18 | |
| # | Time | Type | Order | Size | Price | S / L | T / P | Profit | Balance |
| 1 | 2009.08.05 22:00 | buy | 1 | 0.10 | 1.44157 | 1.44103 | 0.00000 | ||
| 2 | 2009.08.05 22:45 | s/l | 1 | 0.10 | 1.44103 | 1.44103 | 0.00000 | -5.40 | 9994.60 |
| 3 | 2009.08.13 03:00 | buy | 2 | 0.10 | 1.42192 | 1.42138 | 0.00000 | ||
| 4 | 2009.08.13 03:50 | s/l | 2 | 0.10 | 1.42138 | 1.42138 | 0.00000 | -5.40 | 9989.20 |
| 5 | 2009.08.20 23:00 | buy | 3 | 0.10 | 1.42551 | 1.42497 | 0.00000 | ||
| 6 | 2009.08.20 23:20 | s/l | 3 | 0.10 | 1.42497 | 1.42497 | 0.00000 | -5.40 | 9983.80 |
| 7 | 2009.08.24 00:00 | buy | 4 | 0.10 | 1.43467 | 1.43413 | 0.00000 | ||
| 8 | 2009.08.24 00:03 | s/l | 4 | 0.10 | 1.43413 | 1.43413 | 0.00000 | -5.40 | 9978.40 |
| 9 | 2009.08.24 01:00 | buy | 5 | 0.10 | 1.43400 | 1.43346 | 0.00000 | ||
| 10 | 2009.08.24 01:15 | s/l | 5 | 0.10 | 1.43346 | 1.43346 | 0.00000 | -5.40 | 9973.00 |
| 11 | 2009.08.24 02:00 | buy | 6 | 0.10 | 1.43410 | 1.43356 | 0.00000 | ||
| 12 | 2009.08.24 02:02 | s/l | 6 | 0.10 | 1.43356 | 1.43356 | 0.00000 | -5.40 | 9967.60 |
| 13 | 2009.08.24 03:00 | buy | 7 | 0.10 | 1.43479 | 1.43425 | 0.00000 | ||
| 14 | 2009.08.24 03:50 | s/l | 7 | 0.10 | 1.43425 | 1.43425 | 0.00000 | -5.40 | 9962.20 |
| 15 | 2009.08.27 22:00 | buy | 8 | 0.10 | 1.43594 | 1.43540 | 0.00000 | ||
| 16 | 2009.08.27 22:20 | s/l | 8 | 0.10 | 1.43540 | 1.43540 | 0.00000 | -5.40 | 9956.80 |
| 17 | 2009.08.28 02:00 | buy | 9 | 0.10 | 1.43715 | 1.43661 | 0.00000 | ||
| 18 | 2009.08.28 02:15 | s/l | 9 | 0.10 | 1.43661 | 1.43661 | 0.00000 | -5.40 | 9951.40 |
| 19 | 2009.08.28 03:00 | buy | 10 | 0.10 | 1.43661 | 1.43607 | 0.00000 | ||
| 20 | 2009.08.28 03:50 | s/l | 10 | 0.10 | 1.43607 | 1.43607 | 0.00000 | -5.40 | 9946.00 |
| 21 | 2009.09.01 02:00 | buy | 11 | 0.10 | 1.43373 | 1.43319 | 0.00000 | ||
| 22 | 2009.09.01 02:20 | s/l | 11 | 0.10 | 1.43319 | 1.43319 | 0.00000 | -5.40 | 9940.60 |
| 23 | 2009.09.08 09:00 | buy | 12 | 0.10 | 1.43892 | 1.43838 | 0.00000 | ||
| 24 | 2009.09.08 09:02 | s/l | 12 | 0.10 | 1.43838 | 1.43838 | 0.00000 | -5.40 | 9935.20 |
| 25 | 2009.09.14 19:00 | buy | 13 | 0.10 | 1.46252 | 1.46198 | 0.00000 | ||
| 26 | 2009.09.14 19:15 | s/l | 13 | 0.10 | 1.46198 | 1.46198 | 0.00000 | -5.40 | 9929.80 |
| 27 | 2009.09.16 20:00 | buy | 14 | 0.10 | 1.47203 | 1.47149 | 0.00000 | ||
| 28 | 2009.09.16 20:07 | s/l | 14 | 0.10 | 1.47149 | 1.47149 | 0.00000 | -5.40 | 9924.40 |
| 29 | 2009.09.16 21:00 | buy | 15 | 0.10 | 1.47251 | 1.47197 | 0.00000 | ||
| 30 | 2009.09.16 21:03 | s/l | 15 | 0.10 | 1.47197 | 1.47197 | 0.00000 | -5.40 | 9919.00 |
| 31 | 2009.09.24 15:00 | buy | 16 | 0.10 | 1.47921 | 1.47867 | 0.00000 | ||
| 32 | 2009.09.24 15:10 | s/l | 16 | 0.10 | 1.47867 | 1.47867 | 0.00000 | -5.40 | 9913.60 |
| 33 | 2009.09.24 16:00 | buy | 17 | 0.10 | 1.47599 | 1.47545 | 0.00000 | ||
| 34 | 2009.09.24 16:03 | s/l | 17 | 0.10 | 1.47545 | 1.47545 | 0.00000 | -5.40 | 9908.20 |
| 35 | 2009.09.30 21:00 | buy | 18 | 0.10 | 1.46472 | 1.46418 | 0.00000 | ||
| 36 | 2009.09.30 21:05 | s/l | 18 | 0.10 | 1.46418 | 1.46418 | 0.00000 | -5.40 | 9902.80 |